Economic order quantity (EOQ): formula, example and spreadsheet
The economic order quantity (EOQ) formula explained in simple words, with a worked example, an Excel and Google Sheets formula, and its limits.

Order too little at a time and you are always placing orders, paying shipping and unpacking boxes. Order too much and your cash sits on a shelf, taking up space and collecting dust.
The economic order quantity, or EOQ, is the order size that costs you the least overall. This guide gives the formula in simple words, a full example, and a version you can paste into a spreadsheet.
What is the economic order quantity?
EOQ is the number of units to order each time so that the total of two costs is as low as possible:
- Ordering costs: what it costs you each time you place an order, whatever its size.
- Holding costs: what it costs you to keep a unit in stock for a year.
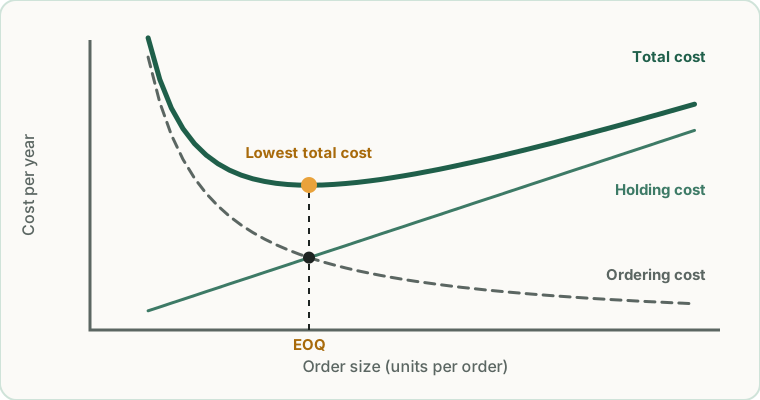
These two costs pull in opposite directions. Big orders mean few orders (low ordering cost) but a lot of stock (high holding cost). Small orders mean the reverse. EOQ is the point where they balance.
The EOQ formula
EOQ = √ (2 × D × S ÷ H)
| Letter | Meaning | Example |
|---|---|---|
| D | Demand: units you sell in a year | 2,400 units |
| S | Cost to place one order | $50 |
| H | Cost to hold one unit for one year | $3 |
What goes into each number
D, annual demand. Use last year’s sales of that product, or your forecast. If the product is new, multiply an average month by 12.
S, ordering cost per order. Count only what you pay each time you order, whatever the quantity:
- the supplier’s flat shipping or handling fee;
- customs or brokerage fees per shipment;
- your time to prepare the order, receive it, check it and pay the bill.
Do not include the price of the goods themselves.
H, holding cost per unit per year. Count what it costs to keep one unit for a year:
- storage space;
- insurance;
- damage, theft and stock that becomes unsellable;
- the cost of the money tied up in the stock.
A common shortcut is to take a percentage of the unit cost, often between 15% and 30% a year. For a product that costs you $15, a 20% holding rate gives H = $3.
A worked example
A shop sells 2,400 phone cases a year. Each order costs $50 to place and receive. Each case costs $15, and the shop uses a 20% holding rate, so H = $3.
- Multiply: 2 × 2,400 × 50 = 240,000
- Divide by H: 240,000 ÷ 3 = 80,000
- Take the square root: √80,000 = 283 units (rounded)
So the shop should order about 283 cases at a time. From there:
- Orders per year: 2,400 ÷ 283 = about 8.5
- Time between orders: 365 ÷ 8.5 = about 43 days
- Ordering cost per year: 8.5 × $50 = about $424
- Holding cost per year: (283 ÷ 2) × $3 = about $424
- Total: about $849 a year
The holding cost uses 283 ÷ 2 because, on average, half an order is sitting on the shelf. Notice that the two costs are equal: that is always true at the EOQ.
Compared with other order sizes
| Order size | Orders per year | Ordering cost | Holding cost | Total per year |
|---|---|---|---|---|
| 100 units | 24 | $1,200 | $150 | $1,350 |
| 200 units | 12 | $600 | $300 | $900 |
| 283 units (EOQ) | 8.5 | $424 | $424 | $849 |
| 400 units | 6 | $300 | $600 | $900 |
| 600 units | 4 | $200 | $900 | $1,100 |
Two lessons from this table. Ordering 100 at a time costs about $500 a year more than the EOQ. And the curve is flat near the bottom: 200 or 400 units costs only $51 more than 283. You do not need the exact number. Round to a full case or pallet, or to your supplier’s pack size, and you lose almost nothing.
EOQ formula for Excel and Google Sheets
Put annual demand in B1, the cost per order in B2 and the holding cost per unit in B3.
- EOQ:
=SQRT(2*B1*B2/B3) - Orders per year:
=B1/SQRT(2*B1*B2/B3) - Total yearly cost:
=B1/B4*B2 + B4/2*B3(with the EOQ in B4)
If you prefer a holding rate, put the unit cost in B5 and the rate in B6 (for example 0.2), and replace B3 with B5*B6.
You can add these columns to your inventory spreadsheet and calculate an EOQ for each of your best-selling products.
EOQ and reorder point: how much and when
EOQ and the reorder point answer two different questions.
| Question | Tool |
|---|---|
| How much should I order? | Economic order quantity |
| When should I order? | Reorder point |
The reorder point is the stock level that triggers a new order, based on how fast you sell and how long the supplier takes. Safety stock is the buffer on top. Both are explained in our guide to reorder point and safety stock.
Used together: when stock falls to the reorder point, order the EOQ.
EOQ and minimum order quantity
Your supplier’s minimum order quantity (MOQ) is the smallest order they accept. EOQ is the size that is cheapest for you. They are not the same thing.
- If the MOQ is below your EOQ, order your EOQ.
- If the MOQ is above your EOQ, you have to order the MOQ. Use the cost table above to see what the difference costs you per year, and use that number when you negotiate.
The limits of the EOQ model
The formula is more than a century old and assumes a simple world. It assumes that:
- demand is steady all year;
- the unit price is the same whatever the quantity;
- ordering and holding costs do not change;
- the whole order arrives at once.
Real businesses break these assumptions, so adjust:
- Seasonal products. Calculate EOQ per season with that season’s demand, not one figure for the year.
- Quantity discounts. Calculate the total yearly cost, including the price of the goods, at the EOQ and at each discount level. Take the cheapest.
- Perishable or fast-changing products. Cap the order at what you can sell before it expires or goes out of style, even if the EOQ is higher.
- Limited cash or space. If the EOQ is more than you can pay for or store, order less. The flat curve means the penalty is small.
EOQ is a starting point for a decision, not a rule to follow blindly. Recalculate when your sales, supplier fees or costs change noticeably. Your inventory turnover ratio is a good check: if turnover drops after you change order sizes, you are probably ordering too much.
Common questions
What is EOQ in simple words?
It is the order size that keeps the combined cost of ordering and storing a product as low as possible.
How do I calculate holding cost if I do not know it?
Use a percentage of what the unit costs you. Between 15% and 30% a year is a common range. Start with 20% and refine it when you know your storage and financing costs better.
Is EOQ still useful for a very small shop?
Yes, as a sanity check. If you are ordering every week and the formula says every six weeks, you are probably spending too much on shipping and time. If it says order two months of stock and you order a year’s worth, you are tying up cash.
What is the difference between EOQ and reorder quantity?
The reorder quantity is whatever amount you actually order each time. EOQ is one way of choosing it, the one that minimizes cost.
Key takeaways
- EOQ = √ (2 × annual demand × cost per order ÷ holding cost per unit per year).
- At the EOQ, yearly ordering cost and yearly holding cost are equal.
- The cost curve is flat near the EOQ, so rounding to a pack size is fine.
- EOQ tells you how much to order. The reorder point tells you when.
- Adjust for seasons, discounts, expiry dates and your cash.
Related guides

Best free inventory software for small business: 4 options that are really free
Free inventory software exists, with tight limits. Zoho Inventory, Sortly, a spreadsheet and your store's own stock tracking compared, with what each allows.

FIFO vs LIFO: inventory methods explained with a simple example
FIFO vs LIFO vs weighted average explained with one worked example: how each method changes cost of goods sold, ending inventory and profit.

How to create SKU numbers for a small business (with examples)
How to create SKU numbers for your products: seven rules, a format you can copy, examples, and the difference between a SKU, a UPC and a barcode.